


Antoine Vayer und Frédéric Portoleau messen die Leistungen mit "Radaren" an den wichtigsten Anstiegen jedes Wettkampfes. Es wird davon ausgegangen, dass die Fahrer mit fast 100% ihres Leistungsvermögens fahren.
Ein Leistungsdurchschnitt kann berechnet werden (nur für den letzten Anstieg der Etappe und mit einer Anstrengung > 20 Minuten).
Sie finden ein Beispiel für eine Radar-Zone unter watt the fuck ?.
Bitte nutzen Sie die Links zu den verschiedenen Bereichen: Etappen, Leistungen, Artikel.
Bitte wählen Sie einen Wettkampf :
Statistiken von cyclisme-dopage.com
Etappen und Radare 
| # | Datum | Etappe | Anstieg | Durchschnitt | Article | |
|---|---|---|---|---|---|---|
| #10 | 17-07-2018 | Annecy - Grand-Bornand |  | Colombiere |  | |
| #11 | 18-07-2018 | Alberville - La Rosière | | Rosiere | | |
| #12 | 19-07-2018 | Bourg-Saint-Maurice - Alpe d'Huez | | Alpe d'Huez | | |
| #16 | 24-07-2018 | Carcassonne - Bagnères-de-Luchon | | Portillon | | |
| #17 | 25-07-2018 | Bagnères-de-Luchon - Saint-Lary-Soulan | | Portet | | |
| #19 | 27-07-2018 | Lourdes - Laruns | | Soulor | |
Leistungen (Wettkampfdurchschnitt)
| Fahrer | Colombiere | Rosiere | Alpe d'Huez | Portillon | Portet | Soulor | Durchschnittliche Etalon-Leistung 78 kg |
|---|---|---|---|---|---|---|---|
| #1- Geraint Thomas | 433 | 417 | 401 | 419 | 408 | 424 | 417 |
| #2- Tom Dumoulin | 433 | 409 | 401 | 419 | 407 | 428 | 416 |
| #3- Christopher Froome | 433 | 408 | 401 | 419 | 401 | 412 | 412 |
| #4- Primoz Roglic | 433 | 399 | 398 | 419 | 407 | 428 | 414 |
| #5- Steven Kruijswijk | 433 | 396 | 358 | 419 | 405 | 431 | 407 |
| #6- Romain Bardet | 433 | 399 | 403 | 419 | 392 | 395 | 407 |
| #7- Mikel Landa | 433 | 385 | 402 | 420 | 401 | 404 | 408 |
| #8- Dan Martin | 435 | 408 | 389 | 419 | 411 | 409 | 412 |
| #10- Nairo Quintana | 433 | 399 | 392 | 419 | 415 | 373 | 405 |
| #15- Egan Bernal | 435 | 385 | 390 | 419 | 401 | 412 | 407 |
Artikel
Antoine Vayer
 05-08-2018 : [TdF2018] Le dopage paie, par Antoine Vayer
Frédéric Portoleau
02-08-2018 : ROGLIC : une star est née, ou est-ce encore une étoile filante ? par Frédéric Portoleau
30-07-2018 : Un portrait en watts de Geraint Thomas, par Frédéric Portoleau
22-07-2018 : [TdF2018] Performance Miraculeuse : ROGLIC à VINGT secondes du record de PANTANI à Mende. Par Frédéric Portoleau
 De quand datent les calculs ?
F. Portoleau améliore d'année en année sa méthode de simulation, notamment sur les points les plus complexes comme l'aspiration ou la prise en compte du vent. Les données peuvent donc s'affiner au fil du temps.
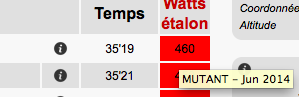
Pour connaître la date de calcul d'une donnée en Watts, il vous suffit de survoler la valeur, et l'information va s'afficher.
Suivant